Categories
Recover More Uncategorized

A Newcomer's Perspective on MRFs

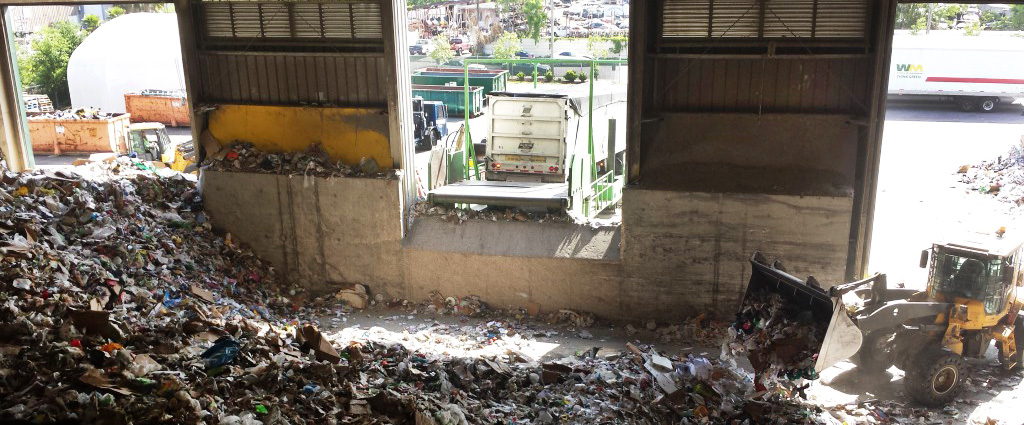
SUSTPACK 2015 started early Tuesday with a tour of place many consumers will contribute to each week, but will never think about — A Waste Management facility. The tour of the Tampa, FL facility started with an introduction to Waste Management’s (WM) recovery numbers and a brief overview of what materials the Tampa facility can recycle. A few of the recycling figures stood out to me — an admitted newbie to the recycling and sustainability industry.

  • In 2010, the U.S. produced 250 million tons of municipal solid waste
  • While paper and paperboard take the prize for biggest percentage of total municipal solid waste (28.5%), diapers alone represent 3.4% of total municipal solid waste!
  • Roughly 34% of total municipal solid waste is recycled, meaning 1/3 of our trash is diverted from landfills and other garbage disposal locations.

SUSTPACK MRF
The many levels of conveyor belts inside the Tampa, FL facility.

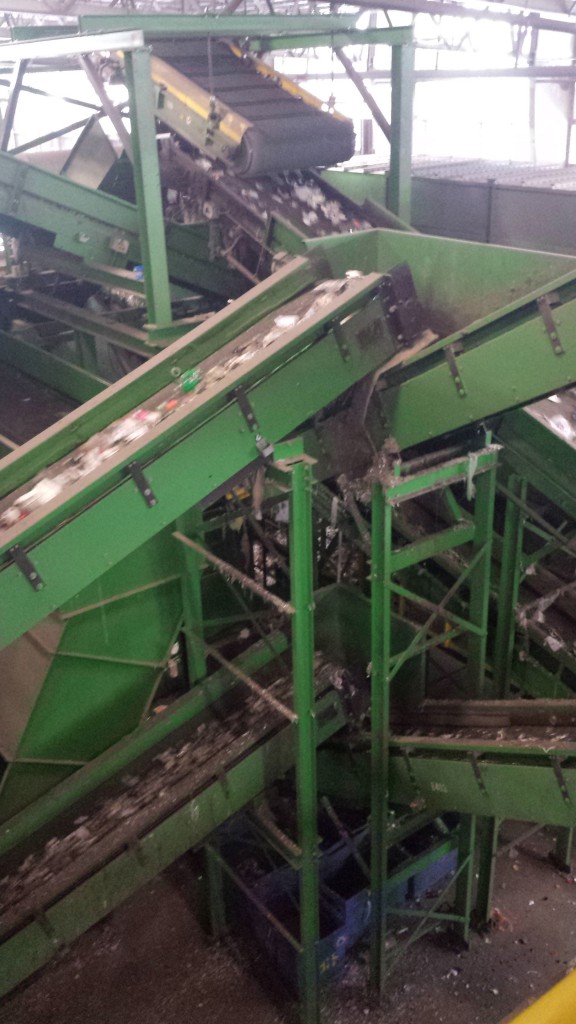
Then, it was time to see where the recycling magic happens. Inside the warehouse we were able to watch as workers made split second decisions about what had to be taken out of the recycling flow. Some of my favorite random objects that people had recycled included yellow caution tape, a dust bin, and two closet doors. It reinforces the belief that recyclability education is very much lacking in the U.S.
While the closet doors may have been an entertaining outlier, seeing how many plastic bags and styrofoam containers ended up at the WM facility I realized firsthand how important the How2Recycle program and website is as a resource to consumers. When consumers see the numbers on the bottom of different packages, they often think it can automatically be recycled; I definitely did before I started working for GreenBlue.
Beyond promoting consumer recycling, the tour of the WM facility taught me so much about the limitations of individual facilities. While this particular facility receives products from a single stream recycling system, many counties are not able to utilize this type of collection method. Single stream reduces the effort required on the part of the consumer, but increases costs at the facility. Dual stream requires consumers to be more educated about how to properly separate recyclable products. The facility representative expressed how he would like to accept more items, like styrofoam, but how it just isn’t possible with equipment at his facility. As an average consumer who recycles, I was led to believe that all recycling facilities accept all the usual suspects: water and soda bottles, printer paper and magazines. This just isn’t the case and it really takes due diligence on the part of the citizen to learn about their local recycling services.
I believe that we communications professionals working in the recycling and sustainability sphere have our work cut out for us when it comes to informing the public about these “invisible” facilities and what consumers can do to improve recycling output.

Categories
Recover More Sustainability Tools Sustainable Packaging Coalition

Part 1: Packaging System and Sustainability

Tertiary Packaging and COMPASS®

The Sustainable Packaging Coalition began in 2005 with the Definition of Sustainable Packaging that emphasizes the responsible use of materials for packaging using a life-cycle approach.  A great deal of the effort has been focused on improving the primary packages—the ones we take home that physically contain the product companies are selling. Innovations in packaging design and materials have continued at a steady pace to adapt to changing market trends, consumer preferences, regulations, and waste reduction efforts. These changes are quite visible on the shelves of our favorite shops. With that said, there are other kinds of packaging that provide crucial services behind the scenes that shoppers may not think about but are vital in delivering products to our favorite shops’ shelves.
This packaging is sometimes referred to as secondary and tertiary packaging and is used for business-to-business (B2B) transactions. A common example of secondary package is the ubiquitous brown corrugated box. A wood pallet, the kind we see behind the grocery store or at big box stores, exemplifies a tertiary package. Both secondary and tertiary packaging may be used to collate goods for delivery. Each type of package is developed to serve a specific service with the goal of delivering the product safely and intact from the manufacturer to the end user. The image below illustrates the different packages and their general role beginning with the wine bottle as the primary package, providing direct protection and marketing appeal for the product, the box with its foam cushion as the secondary package, protecting the larger grouping of the product, and the pallet as the tertiary package, providing the support necessary for safe transport of the product to its destination.

Of course, this is a simplified illustration and there are many other variables that need to be accounted for in order to deliver the product to the shop shelf. Factors that influence the types and combination of packaging employed may include things like product weight and fragility, spoilage consideration, stacking strength, temperature and weather, transport method, etc. These complexities go into the ultimate design of the system, and sustainability outcomes need to be included in the design flow to assess the impact of delivering the product. In order to improve the system one must be able to quantify the implications of everything that goes into making the items that make up the whole delivery system. In the illustration above, this includes all the materials (glass, metal, paperboard, plastics, wood etc.), the processes needed to make the packaging from the materials, any supplemental components needed such as plastic wrap or straps, and the overall implications to transportation.
The discipline of life cycle assessment (LCA) provides a convenient tool that is increasingly used by designers and companies to develop a model that quantifies the overall environmental burdens associated with product and service delivery. Quantification of environmental impacts can help improve the choices made during the design process to positively impact the corporate sustainability strategy. GreenBlue’s COMPASS® (comparative packaging assessment) is an LCA tool tailored for packaging design evaluation and improvement. Historically, it’s been used for optimizing the primary packaging. But, this October, COMPASS will start to include a new model to quantify the entire system, to include both single use and reusable tertiary packaging.
In the next installment, we will examine packaging in the solid waste stream, in particular secondary and tertiary packaging and what happens to those materials.